In previous sections, you learned how to create reports, charts, and maps (let's call them “objects”), and how to publish them in dashboards. This section describes how to add and manage alerts in objects, how to “watch” alerts in dashboards and how to monitor alerts automatically.
An alert is a range of some indicator (for example, profits/losses, sales, up-time, etc) you want or do not want the indicator to reach. If the indicator's value reaches into the alert range (in other words: if an alert was triggered), you will be instantly informed about that, so you can fix issues in a timely manner. More detailed information about alerts can be found in Section 10.1 - What is an Alert.
First of all, you have to create the alert. That means that you have to select which indicator you want to watch and what values are critical for you. Each object (report, chart, or map) can have its own alerts.
In Section Q.5.4.2 - Control Areas, you learned how to add a “control area” into a chart. That is all you have to know to add alerts into charts – just open a chart in Chart Designer and add one or more control areas into it. Basically, you can think of a control area as an alert in a chart.
Launch ERES Organizer (as described in Section 2.1.1 - Starting the Organizer), expand Examples/Dashboards/Alerts Components and double-click on the Sales By Employee Chart.
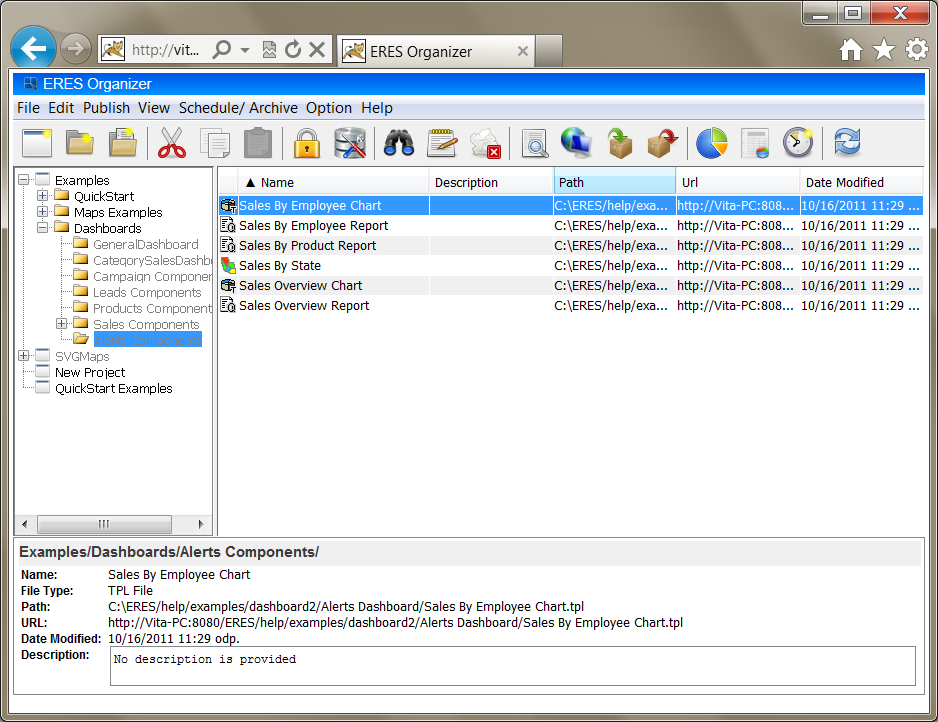
Sales By Employee Chart Location
The Enter Dialog will show up. You do not have to change any parameter values, so just click to continue. You should be able to see a chart now. You may notice that at least one control area has been already added into the chart. The existing control area represents minimal sales limit – no employee should sell less than the limit. We will add another alert that will indicate that employee's personal sales are not optimal, although they are not critically low.
Open the and choose the Control Area option. Control Area Options dialog has appeared.
![[Note]](../../../images/note.png) | Note |
|---|---|
You may have noticed that the Control Area Options dialog contains two control areas, but you can see only one control area in the chart. That is because one control area ( |
To add a new control area, click on the button. Now, it is time to set up our new alert. The first option is called Label. The Label is set to New Range by default. Delete the default label and set it to Not Optimal instead.
Now we will set up the alert range. Set the Value Axis Starting Scale to 20000 and the Value Axis Ending Scale to 40000.
To include the control area in the legend, choose the Show Label In Legend option.
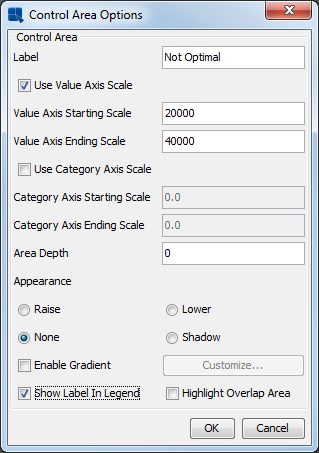
Control Area Options
| Note |
|---|---|
Complete description of this dialog can be found in Section 3.14.6.3 - Adding Control Areas |
Click to close the dialog. As you can see, our new alert was created successfully. Now click again to go back to the Chart Designer. The new control area has appeared in the chart. It is highlighted by a random color. To change the color, click on the new area and then choose an indicative color (for example, light red) from the Color panel on the right side of the window. Save the chart and close the Chart Designer.
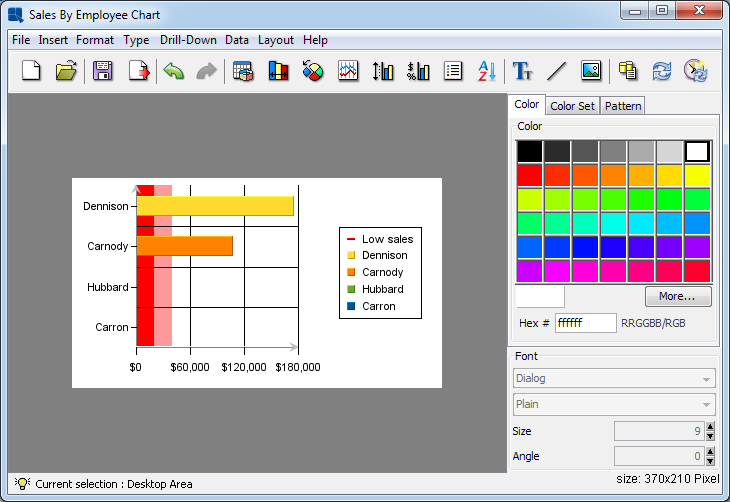
Sales By Employee Chart
Go to the ERES main page and click on the Quick Designer button. Select Open an existing report/chart and click . Expand Examples/Dashboards/Alerts Components nodes, select the Sales By Employee Report report and click .
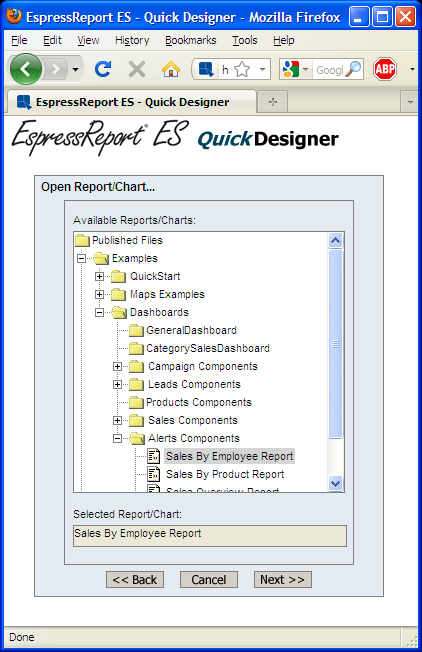
Sales By Employee Report Location
A dialog will appear allowing you to set parameter values for the report. The default values are fine, so just click . You should be able to see a green report. We will add an alert into the report. To do that, click on the ![]() icon. Manage Alerts dialog should show up.
icon. Manage Alerts dialog should show up.

Manage Alerts Dialog
From the dialog, you can tell that one alert has been already added into the report. Its name is Low sales and it is using the Sales column.
To add a new alert, click on the button. Type No sales in the Alert Name field. Leave the Report Element option set to Column. Choose the Quantity column in the Report Columns list. Set the Condition option to Equal and insert 0 ("zero") into the remaining field.
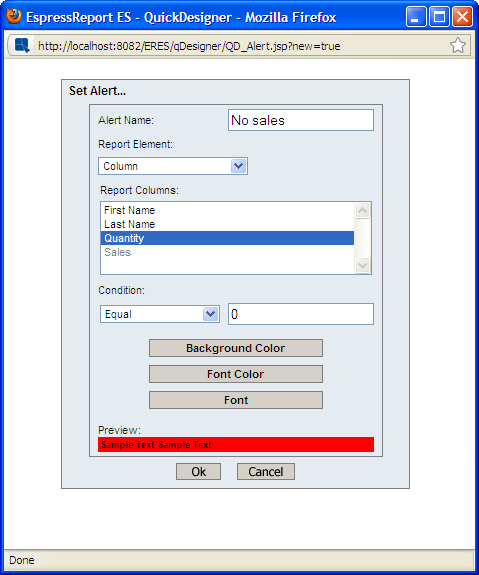
Set Alert Dialog
Alerts in reports also support conditional formatting which means that if an alert was triggered, the value or values that caused it will be highlighted in the report. This feature is enabled by default so to use it, you just customize alert field's background color, font color, and font.
Click on the button. As you can see in the Color preview, default background color is red. To change the color, choose a convenient color from the Swatches color table. Click to confirm the changes.
Now click on the button. Change the Font option to Arial (so that the highlighted field's font matches the rest of the report) and click to save the changes.
And that is all. You have successfully configured a new alert called No sales which will be triggered when a value from the Quantity column equals zero.
Confirm the settings by clicking on the button.

Manage Alerts Dialog
You can see that your new alert was added into the alert list, so there are two alerts now. Click to close the dialog. Now click on the ![]() icon and then click . Close the “Report saved successfully...” window. Click on the
icon and then click . Close the “Report saved successfully...” window. Click on the ![]() icon in the top-right corner of the QuickDesigner window to exit the QuickDesigner.
icon in the top-right corner of the QuickDesigner window to exit the QuickDesigner.
In the Section Q.7 - Maps, you created a SVG map with thresholds. This means that you have also created a map with alerts because thresholds are equivalent to alerts in maps.
Let's add a threshold into an existing SVG map. Open ERES main page and click on the . Select Open existing Map/Coordinates and click . Expand Examples/Dashboards/Alerts Components nodes, select the Sales By State map and click . Click to use default parameter values. To manage thresholds, click on the ![]() icon.To add new threshold (alert), click on the
icon.To add new threshold (alert), click on the ![]() icon. In the Enter threshold value dialog, type
icon. In the Enter threshold value dialog, type 100000 and click . As new thresholds are added, some legend labels are not right. The legend labels are important for alerts because they also double as alert names. Set the 40000 – 100000 legend to $40,000 - $100,000. Now set the > 100000 legend label to More than $100,000. Click on the > 100000 color field. Select Color dialog should show up. Choose an appropriate color (for example, green) and click .
Now, the Set Thresholds dialog should look like this:
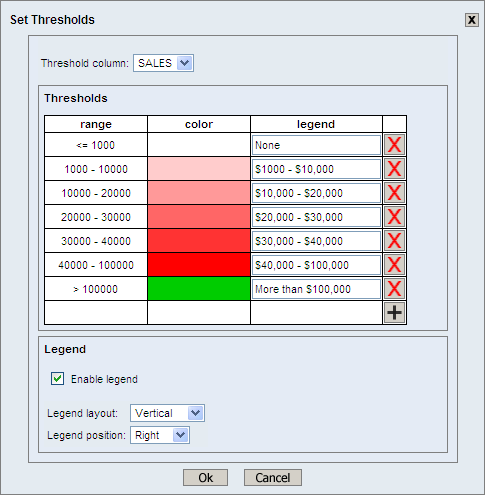
Set Thresholds Dialog
If it does, click to confirm the changes. The map has been changed since you added the threshold. Click on the ![]() icon and click to save the changes. Click
icon and click to save the changes. Click ![]() icon in the top-right corner of the window to go back to the ERES main page.
icon in the top-right corner of the window to go back to the ERES main page.
In previous paragraphs, you added alerts into few objects. Now we want to make use of those alerts. There are two ways to utilize alerts – alert watching and alert monitoring. This paragraph describes how to set up alert watching. Alert watching is set up in dashboards. The basic principle is quite easy: insert some objects (reports, charts or maps) into a dashboard and pick the alerts you want to watch.
Log on to the ERES main page and Launch Dashboard Builder. Click ![]() icon. Expand
icon. Expand Examples/Dashboards nodes, select Alerts Dashboard dashboard, and click . All dashboard objects have ![]() icons in their header bars. That means that all dashboard objects have some alerts that can be watched.
icons in their header bars. That means that all dashboard objects have some alerts that can be watched.
Locate the Sales By Employee Chart chart and click on its ![]() icon. The following dialog should appear.
icon. The following dialog should appear.
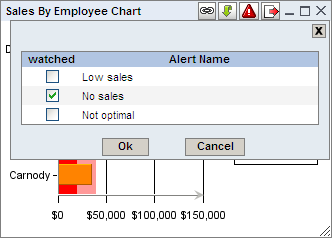
Sales By Employee - Watched Alerts
There is the list of all alerts that you saw in Section Q.9.1 - Alerts in Charts. One alert is set to be watched.
The list also includes the Not optimal alert you created previously. Check the Not optimal checkbox and uncheck the No sales check-box.
Click to close the dialog and then click on the ![]() icon in the main menu. Notice that the chart's border is not flashing. That means that the Not optimal alert was not triggered. Now locate following panel:
icon in the main menu. Notice that the chart's border is not flashing. That means that the Not optimal alert was not triggered. Now locate following panel:
Parameter Panel
Change the Quarter parameter to Q2. The border started flashing, because the alert was triggered with current parameters. In other words: at least one Sales By Employee Chart chart bar ends in the Not optimal control area.
You may also notice that the Sales Overview Report header is flashing. That is because the report contains a watched alert which is triggered. You cannot see the report until you click on its tab header, but you can tell that an alert is triggered in the report.
Please note that alert highlighting or blinking are visible only in Preview of the Dashboard Builder.
Another way of using alerts is alert monitoring. Unlike alert watching, alert monitoring checks alerts even when there is no dashboard running.
Lets set up a new alert monitoring job. Log on to the ERES main page and click on the button. Expand Examples/Dashboards/Alerts Components nodes and select the Sales By Employee Chart file.
Sales By Employee Chart Location
Select Set Alert Monitoring from the Schedule/Archive menu. The following dialog should show up:

Setup Alert Monitoring Dialog
Click on the button. Expand Examples/Dashboards/Alerts Components nodes, select the Sales By Product Report report and click .On the Set Alert Monitoring dialog select Low sales and Low revenue alerts. Type Low sales into the Display Name field. The dialog should look like this now:
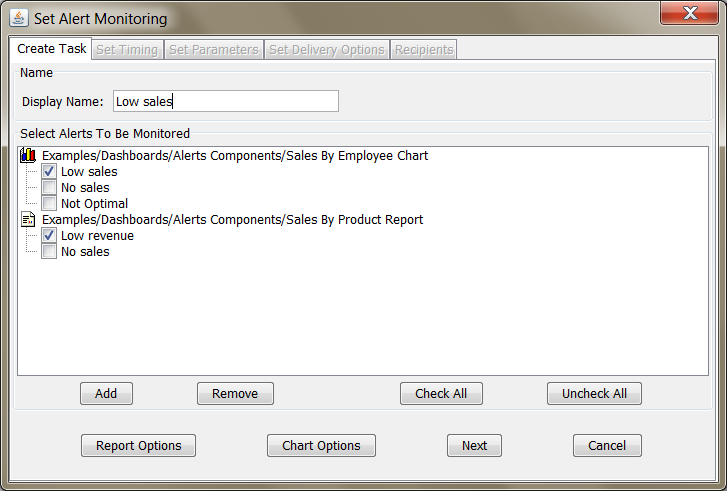
Setup Alert Monitoring Dialog
If it does, click .
You should be on the Set Timing tab now. By default, the alerts would be checked just once, few minutes after configuring it. Select the At a regular time interval option. Set Time Interval dialog should show up. Default time interval is 1 minute, which is fine for us, so just click to confirm it. Uncheck the Run Indefinitely checkbox and click the button right next to it. Set the end time one hour to the future (so you do not have to delete the job manually after you are done with this QuickStart chapter) and click . The dialog should look like this:

Set timing
Click . Click to add new parameter set to the Sales By Employee Chart chart. Click to use default parameters. Click on the Sales By Product Report tab header, click and again and then click . The next step is configuring delivery options. This requires further knowledge and we will skip this step right now. If you are interested in setting delivery options, see Section 10.4.3.1 - Create/Edit monitoring dialog. Click . The following dialog should appear allowing you to check your settings before saving the alert monitoring job. Click to save the alert monitoring job.

Alert Monitoring Summary
You should be back in Organizer now. Click on the Schedule/Archive pull-down option in the main Organizer menu and select View Alert Monitoring Tasks option. The following dialog should open:
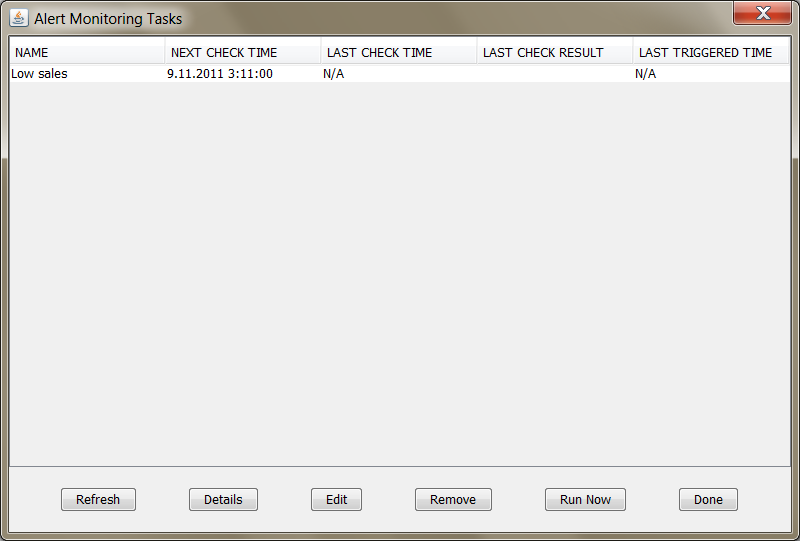
Alert Monitoring Tasks Dialog
The Low sales task should be on the list. Check the Last check time value. If no check was performed until now, it will show N/A. You can either wait for next automatic check (look at the Next check time if you want to know when that's going to happen) and then click . You can also select the Low sales task and click and then click .
After the task was checked, click . You should be able to see the results.
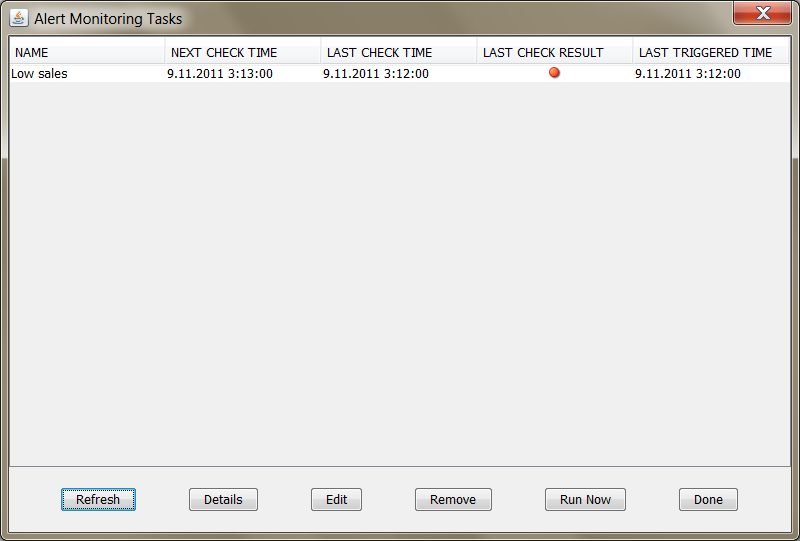
Alert Monitoring Tasks Dialog
The Last check result indicator is red. That means that at least one alert was triggered during last check. Also notice that the Last triggered time is now the same as Last check time.
Select the Low sales task and click . Select the Sales By Product Report and then click on the button. Click and then click to save the changes.
Wait for the automatic check or click again. Click .
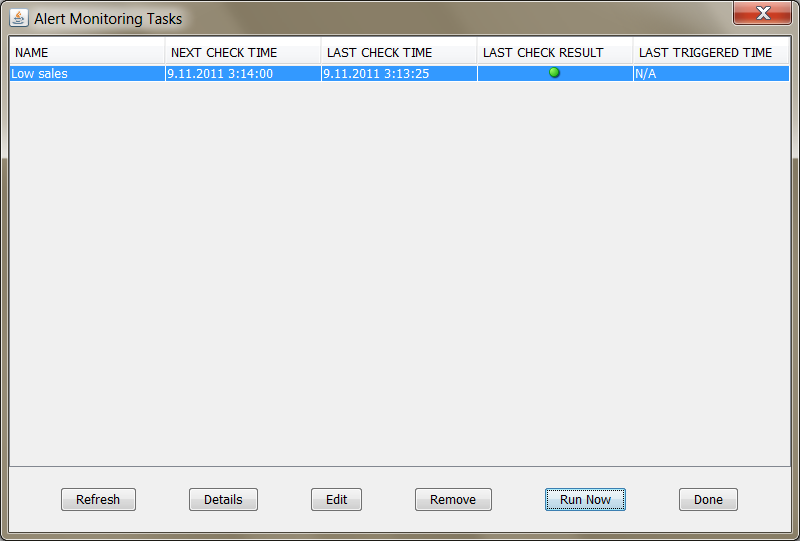
Alert Monitoring Tasks Dialog
Now, the Last check result indicator is green. That means that no alert was triggered during last check.
| Note |
|---|---|
Please, keep in mind that this is just a quick guide which should guide you through basic steps of configuring alert monitoring. In reality, data in the database would be changing constantly; therefore, you would not have to change alert monitoring job properties in order to trigger/not trigger an alert. |