In the previous sections we looked at setting up ERES and creating reports and charts. This last two sections deal with publishing reports and charts. This chapter discusses the automated publishing features in ERES and the next chapter offers some API (programming) examples.
In addition to URLs and the menu page, ERES also allows you to publish reports and charts using a dashboard interface. Dashboards can place multiple charts and report tables into a single presentation page. Users can define common filters for the dashboard items and set up drill-down for individual dashboard items.
Dashboards are created in the thin-client Dashboard Builder interface. To launch the Dashboard Builder, click the link in the ERES start page. The interface will allow you to build a new dashboard.
Dashboard Builder Interface
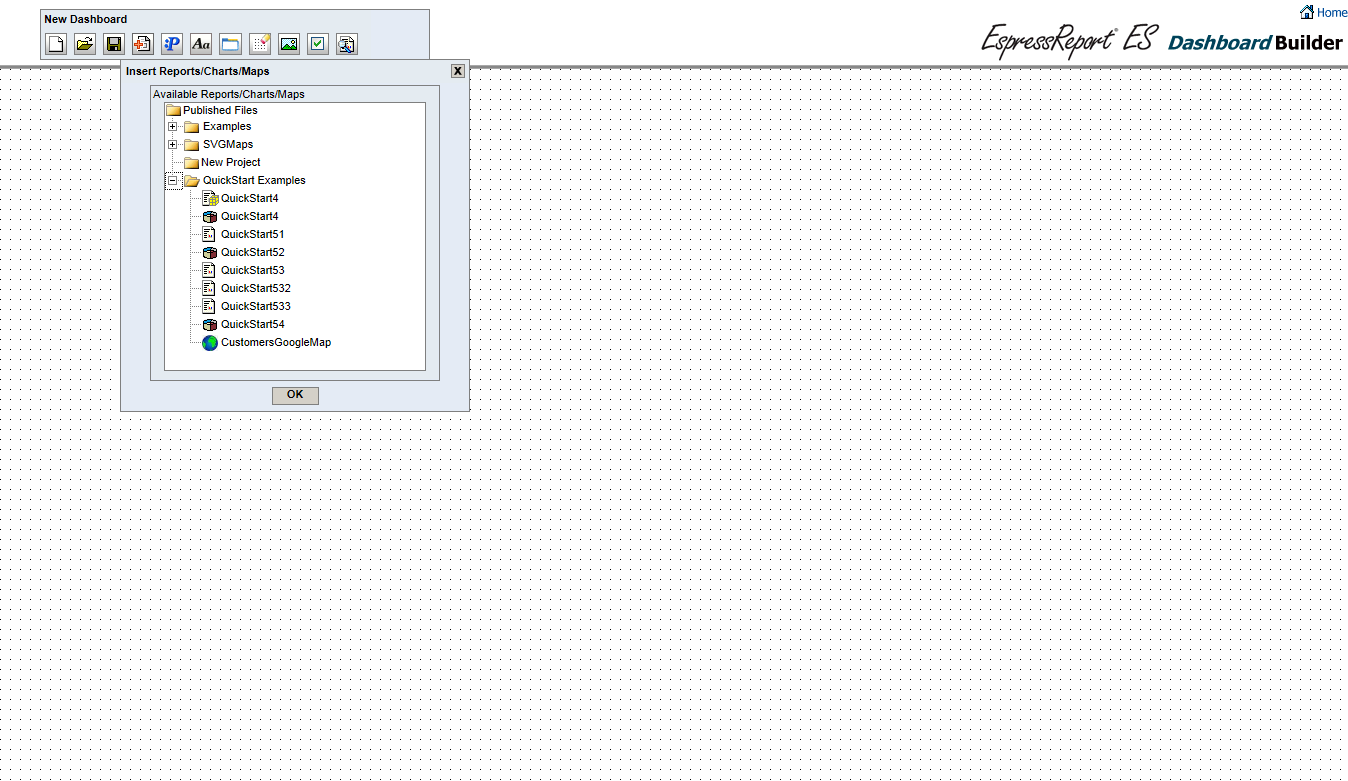
In this section we will guide you through creating a dashboard from report, chart, and map templates that come with ERES installation. At first we need to add some templates to the dashboard. To add reports, charts, or maps to the dashboard, click the icon ![]() on the dashboard toolbar. After you have clicked the button, the Insert Reports/Charts/Maps dialog will appear. The dialog contains a tree that mirrors the folder structure in the Organizer. Next, expand the Examples node and then the QuickStart and QuickStart Dashboard sub-nodes as shown on the image below.
on the dashboard toolbar. After you have clicked the button, the Insert Reports/Charts/Maps dialog will appear. The dialog contains a tree that mirrors the folder structure in the Organizer. Next, expand the Examples node and then the QuickStart and QuickStart Dashboard sub-nodes as shown on the image below.
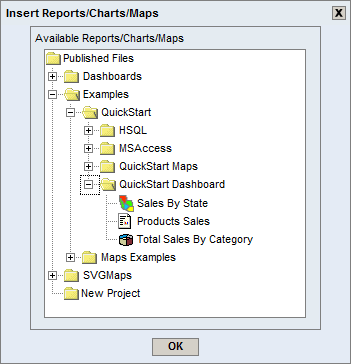
Insert Reports/Charts/Maps Dialog
From the dialog click on all the templates (Total Sales By Category chart,Sales By State map, and Products Sales report) in the QuickStart Dashboard node. This will insert the templates into the dashboard. Once you have inserted the templates, close the dialog by clicking button.
Now move the Sales By State map template by clicking to the map header and drag it to the lower left position in the dashboard. Then select the Total Sales By Category chart and drag it to the upper right position in the dashboard. Finally, move Products Sales report and drag it below the chart. You can also resize the chart/report/map by clicking and dragging the sizing handle that appears in the lower right corner of the templates. After completing these steps, the dashboard should look like the following image:
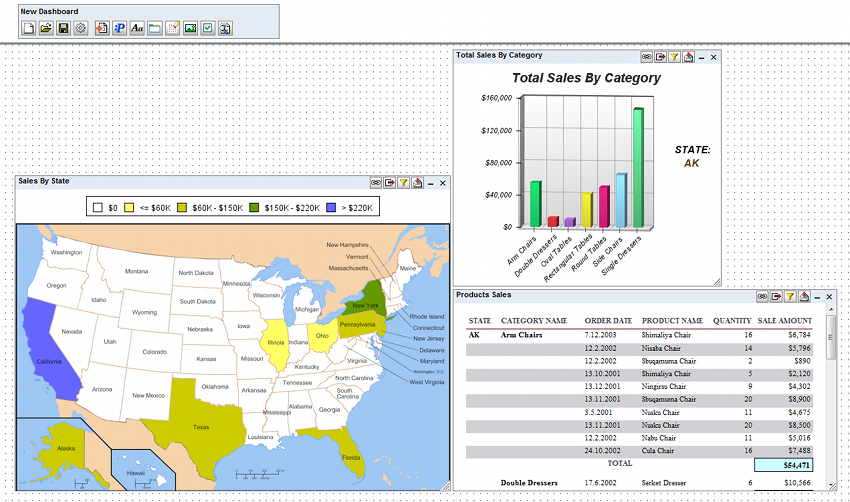
Dashboard with Added Templates
Next, we will add dashboard shared parameters that allow us to group common parameters from the chart, report, and map into a single parameter. First open the Shared Parameters dialog by clicking on the icon ![]() on the toolbar. This will open the Share Parameters dialog that allows you to add shared parameters to the dashboard.
on the toolbar. This will open the Share Parameters dialog that allows you to add shared parameters to the dashboard.
Share Parameters Dialog
From the dialog, click button. This will open another dialog that allows you to specify a shared parameter.
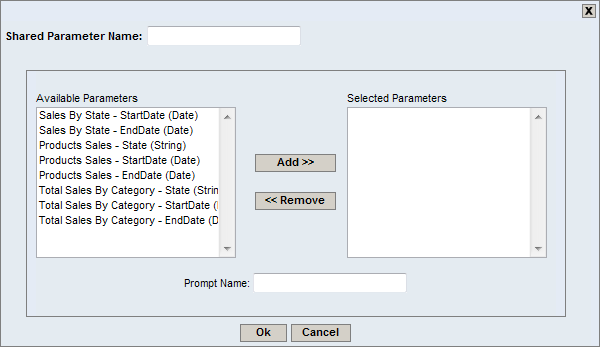
Shared Parameter Dialog
The left-hand side of the dialog shows all the available parameters from all the charts/reports/maps in the dashboard. You can select which parameters you would like to add to the selected parameters list by selecting them in the left-hand side and clicking the button. Note that all parameters in the selected parameters list must have the same data type.
In this example, we will create two shared parameters (Start Date and End Date) and put them into a date range panel. We will start with the first parameter (Start Date). First, enter the parameter name Start Date to the Shared Parameter Name text box at the dialog top. Enter the same text to the Prompt Name text field and then select all the Start Date parameters from the list on the left (you can select the parameters by CTRL+Clicking on the appropriate items in the list). After you have selected all the Start Date parameters from the list, click the button. This will add the selected parameters to the list on the right. At this moment the shared parameter dialog should look as follows:
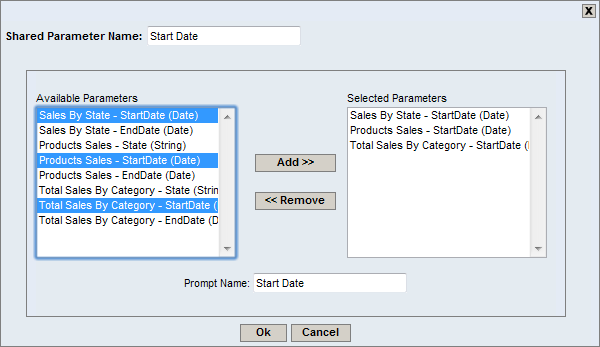
Shared Parameter Dialog - Start Date Parameter
Now click the button. This will put you back to the shared parameters dialog. As you can see the new shared parameter Start Date has been added to the shared parameters list.
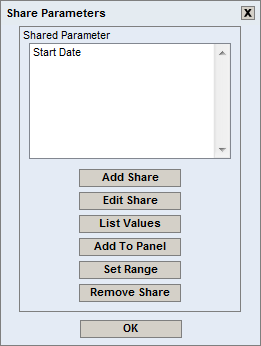
Share Parameters Dialog - Start Date parameter added
Next, we will add the second shared parameter End Date in the same way as mentioned above. From the dialog click the button again, which will open the shared parameter dialog. Enter the parameter name and the prompt name End Date and select all the End Date parameters from the list on the left. After you have selected all the parameters, click the button.
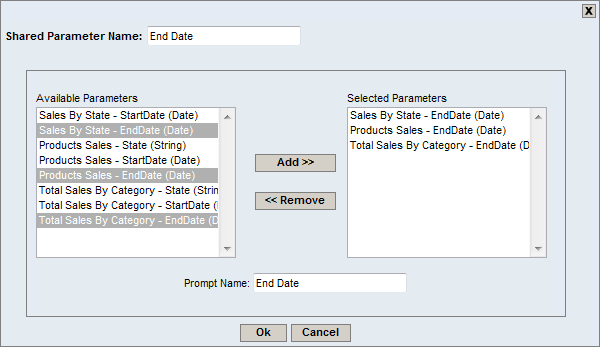
Shared Parameter Dialog - End Date Parameter
Click button. After adding both parameters you should see the same shared parameters dialog as follows:
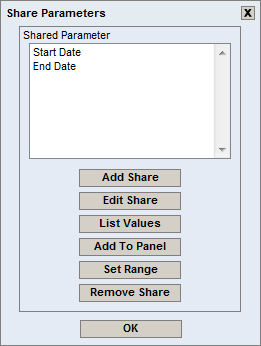
Shared Parameters Dialog - Added Parameters
In the dialog, select both parameters by CTRL+Clicking on the parameters as shown in the image below.

Shared Parameters Dialog - Selected Parameters
After selecting the parameters, click button. This will open the Set Range dialog that allows you to specify ranges for the parameters.
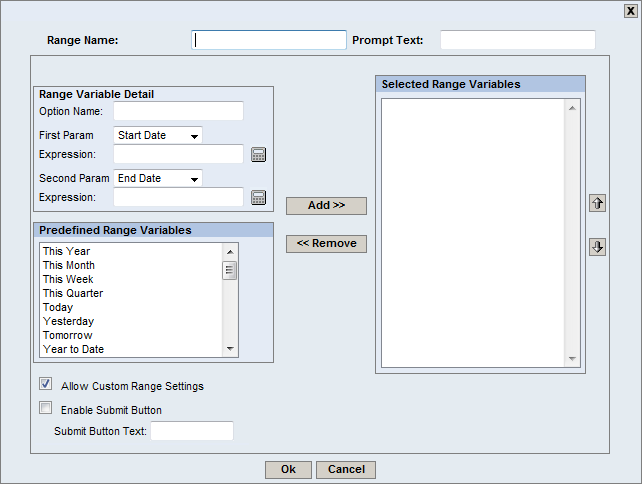
Set Date Range Dialog
As you can see there are lot of options in the dialog. Please note that we will describe only the options necessary for the example. For more information about the rest of options, please see the Section 5.1.1.3.2 - Parameter Range.
First, specify the Range Name in the text box at the top of the dialog, e.g. DateRange. The name represents the title for the Date Range panel. Next, specify the Prompt Text to be Date Range. This text will be then displayed next to the selected date parameter drop-down menu in the Date Range panel. After entering the names, we will proceed with creating date ranges.
For simplicity we will add only two date ranges (Year 2003 and Year 2002) in this example. The range Year 2003 will include all the dates in year 2003 (dates from 2003-01-01 to 2003-12-31 in the Year-Month-Day format). Similarly, the range Year 2002 will include all the dates in year 2002 (dates from 2002-01-01 to 2002-12-31).
Now specify the name for the first range in the Option Name text box to be Year 2003. Next, enter the expressions for the Start Date and End Date parameters to be 2003-01-01 and 2003-12-31. Once you have entered the Range Name as well as the expressions, click button. This will add the date range to the list of selected ranges on the right.
Similarly, add the second date range Year 2002. As mentioned above, first specify the range name to be Year 2002 and enter the expressions for the Start Date and End Date parameters as 2002-01-01 and 2002-12-31. After that, click the button to add the range to the list of selected ranges on the right.
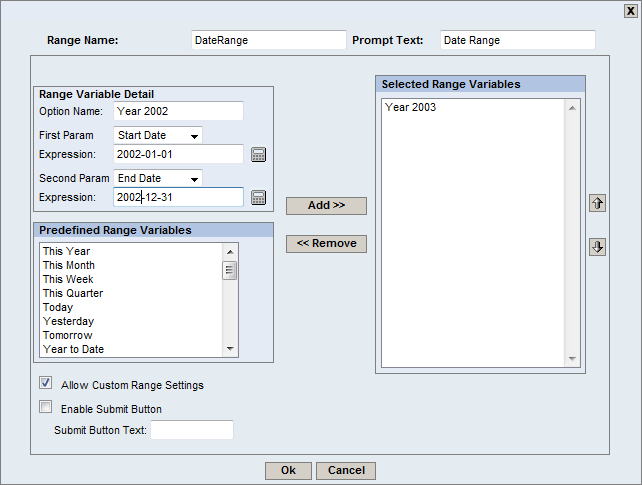
Set Date Range Dialog - Specified Ranges
Once you have added both date ranges into the selected date ranges list on the right, click button. After that the date range panel appears.

Date Range Panel
Now move the panel above the map as shown on the image below. To move the panel, just click on the panel header and drag it to the desired location. You can also resize the panel by clicking and dragging the lower right corner of the panel. The resizing rectangle will then appear, allowing you to adjust the size of the panel.
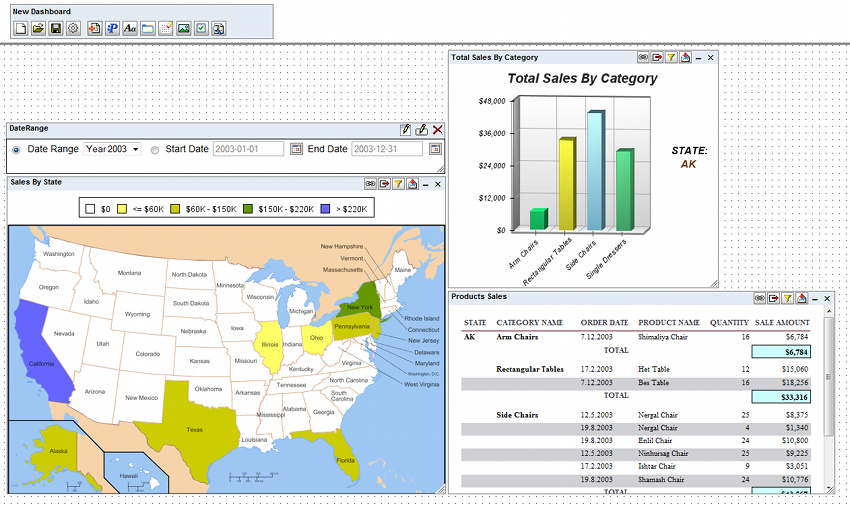
Dashboard With The Date Range Panel
The last thing we will do in this example will be adding links from the map to the chart and report in the dashboard. This will enable sending the State parameter from the map data points to the chart and report.
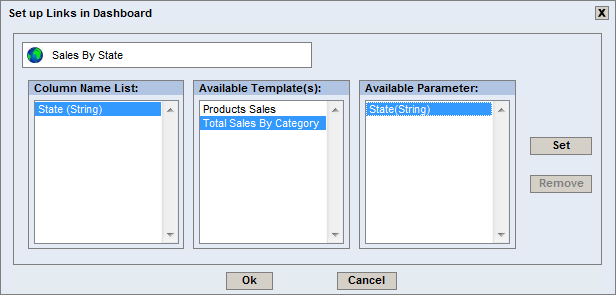
To set up links from the map, click the icon ![]() from the map header. This will open the Set Up Link dialog below. There are three lists in the dialog. The first list contains all the available data columns and their data types in the source template (in our case ,
from the map header. This will open the Set Up Link dialog below. There are three lists in the dialog. The first list contains all the available data columns and their data types in the source template (in our case ,Sales By State map). The second list shows all the available destination templates in the dashboard (in our case, Product Sales report and Total Sales By Category chart). Finally, the third column contains all the available parameters in the selected destinate template. Please note that the third column will show the parameters only after selecting the destination template in the second list.

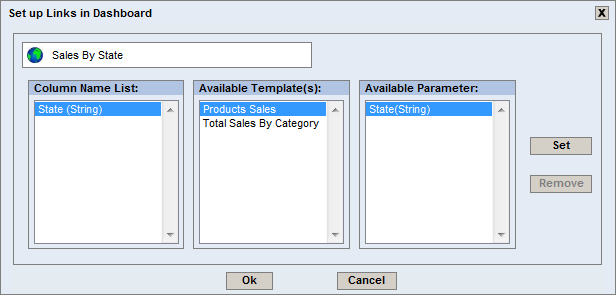
Set Up Links Dialog
To set up a link from the map to the Product Sales report, select State (String) item in the first list and the Product Sales item in the second list. This will cause showing the parameters from the report in the third list. After that select State(String) item from the third list. This should enable button as shown on the image below. Click the button to set up the first link.
Set Up Links Dialog - Link From The Map To The Report
Similarly, set up a link from the map to the Total Sales By Category chart. First, select State (String) item in the first list and the Total Sales By Category item in the second list. This will cause the parameters from the chart in the third list to be shown. From the third list select State(String) item. This should enable button as shown on the image below. Set up the second link by clicking the button.
Set Up Links Dialog - Link From The Map To The Chart
Once you have set up both links, click button that will close the dialog. At this moment the links from the map should be set up. So if you now click on a data point in the map, the chart and report should refresh according to the data point parameter value.
To finish our dashboard, we will just add a dashboard title and choose a dashboard background color. To add the title, click the icon ![]() from the toolbar. A small rectangle will then follow your mouse cursor. Position the rectangle where you would like to insert the label and click. This should add the label panel into the dashboard. Next, double click to the label panel to edit the label text. Enter e.g.
from the toolbar. A small rectangle will then follow your mouse cursor. Position the rectangle where you would like to insert the label and click. This should add the label panel into the dashboard. Next, double click to the label panel to edit the label text. Enter e.g. SALES BY STATE DASHBOARD text and click outside of the label panel. You may also want to resize the label because the label is now too small to be the dashboard title. This can be done from the label properties dialog that opens after clicking on the icon ![]() on the panel header.
on the panel header.
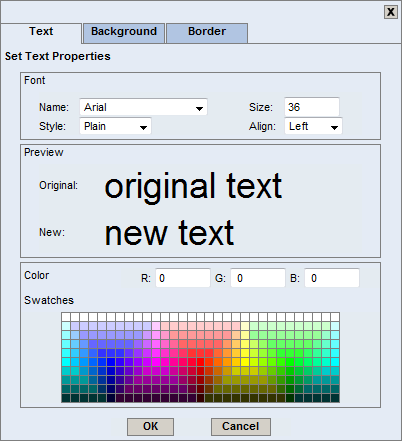
Set Label Properties Dialog
You can specify various properties for the label from this dialog. In the dashboard preview screen shot below, we just increased the label font size to 36px in the Text tab, disabled the panel border in the Border tab, and set up the label background color to be transparent in the Background tab. For more information about the label properties, please see Section 5.1.1.4 - Inserting Labels.
To change the dashboard background color, just click the icon ![]() on the toolbar. This will open the Set Dashboard Background dialog from which you can choose the dashboard background color.
on the toolbar. This will open the Set Dashboard Background dialog from which you can choose the dashboard background color.
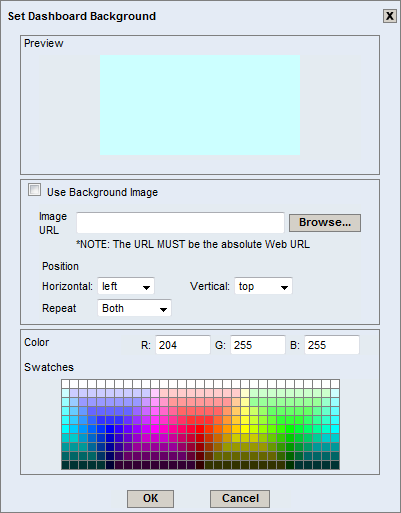
Set Dashboard Background Dialog
Once you have chosen the dashboard background color, you may preview the dashboard by clicking the button ![]() on the Dashboard toolbar. The dashboard display will open in a new window. For more information about dashboard features, see Section 5.1 - Dashboards.
on the Dashboard toolbar. The dashboard display will open in a new window. For more information about dashboard features, see Section 5.1 - Dashboards.
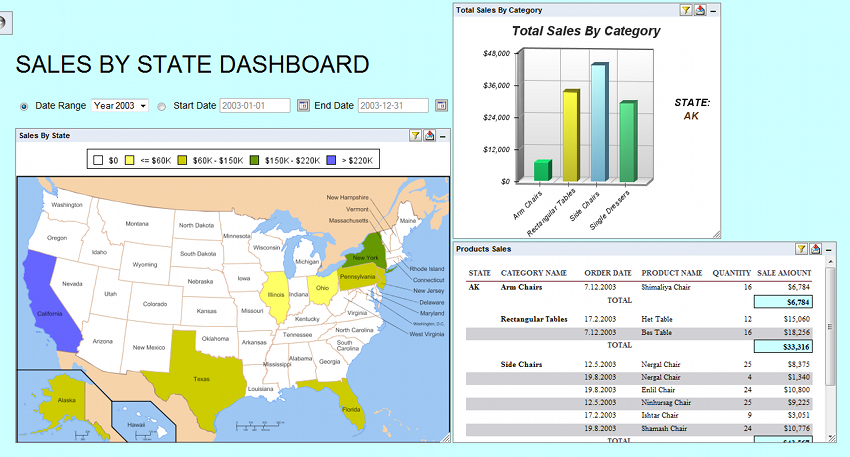
Dashboard Preview
Close the dashboard preview window to return to the main Dashboard Builder interface. Click the button ![]() on the toolbar. A dialog will open prompting you to specify a name for the dashboard.
on the toolbar. A dialog will open prompting you to specify a name for the dashboard.
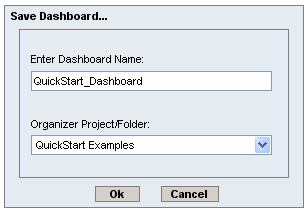
Save Dashboard Dialog
Enter a name for your dashboard and then from the lower drop-down list select the project that you created in Section Q.2.2.2 - Add a Project. Click to save the dashboard. The window will then give you a message that the dashboard was saved successfully. Click to close the dialog.
Click the button ![]() on the Dashboard Builder toolbar and check the option Show toolbar in preview. Click to close the menu. Open the dashboard preview window by clicking the button
on the Dashboard Builder toolbar and check the option Show toolbar in preview. Click to close the menu. Open the dashboard preview window by clicking the button ![]() . Then click the button
. Then click the button ![]() to open the preview toolbar. You can export dashboard to PDF file by clicking button
to open the preview toolbar. You can export dashboard to PDF file by clicking button ![]() from the preview toolbar.
from the preview toolbar.

Export Dashboard from Preview
All the reports, charts, SVG Map and other objects in the Dashboard will be exported to PDF file with the exception of Google Map due to licence restrictions.
Alternatively, you may open the same .dsb file in Published Files (for more information please see Section 6.1 - The Menu Page ), open the Dashboard toolbar and Export PDF there.
Note: There may be small differences in the appearance of elements in export (e.g. radio button shape can change from round to square).
One automated deployment provided in ERES is the ability to run reports and charts via URL calls to the ERES server. Report and chart URLs are documented in detail in Section 6.2 - Image URLs, and Section 6.3 - Report URLs.
To generate a URL, first log into the Organizer, using the steps described in Section Q.2.2.1 - Login as User. With the Organizer interface open, select the project you created (in Section Q.2.2.2 - Add a Project) in the left-hand side. You will see a list of files added from the previous exercises. Select the QuickStart532.rpt file in the organizer (drill-down example that can be created in Section Q.5.3.4 - Drill-Down), and click the button on the toolbar ![]() . A dialog will open prompting you to specify options for the generated URL.
. A dialog will open prompting you to specify options for the generated URL.
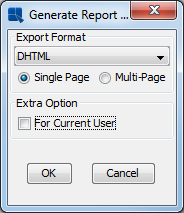
URL Options Dialog
In this dialog, select single page DHTML as the export format and disable the option marked For Current User. This will create the URL without encoding a username and password, prompting users to login when running the URL. Click and the URL will be generated in the Report URL dialog.
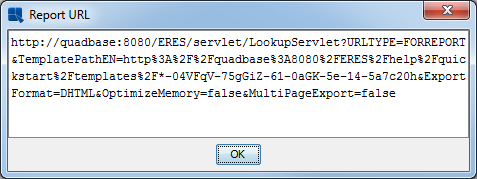
Generated URL
Now, select the generated URL and copy the text to the browser's location dialog. Hit enter to run the URL. You will first be directed to a login dialog because you selected not to pass in the username and password in the URL.
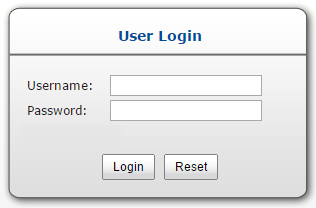
URL Login Dialog
Enter your User Name and Password in the dialog and click the button. The report will then load in the browser.
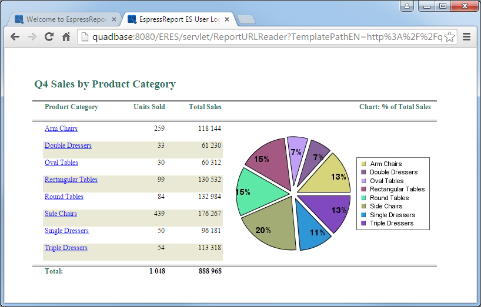
Generated Report
As you can see the drill-down column is generated as hyperlinks in the exported report. Click one of the links and you will go to the lower-level report in the same manner as you did in the preview window.
Another way that ERES automatically publishes reports is through the Menu Page. The Menu Page is a thin-client interface that allows users to run/view the reports and charts to which they have access in the Organizer.
To launch the Menu Page, go to the ERES Start page and login using the user created in Section Q.2.1 - Create a User. When you login the options in the left-hand panel become active. Click the link labeled and the Menu Page will load.
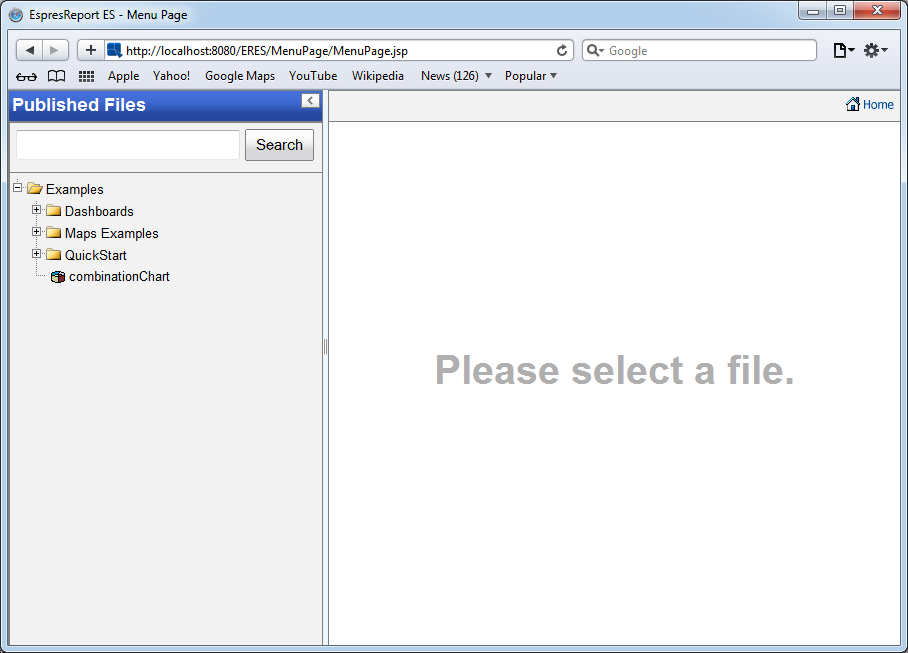
Menu Page
The page contains a list of all the reports and charts in your project and some examples. The only option available is to run the report or chart because you do not have any active schedule or archive jobs. To open a file, expand respective project/folder nodes (in the left-hand tree-list) to locate the file and click on the file name. The file will load in the right-hand DHTML Viewer panel.
For more information about the options and functions available in the Menu Page, see Section 6.1 - The Menu Page.